IntelliQuant
IntelliQuant helps you identify and semi-quantitate elements that are not currently selected in the Elements tab during an analysis.
IntelliQuant screening analyzes solutions for all elements without performing the standard quantitative analysis on selected elements.
This is particularly useful when trying to determine the best wavelength of an element to use during method development.
Information is provided on the following topics:
- How to setup and run a method with IntelliQuant, including how to customize the view and interpret the results
- How to setup and run an IntelliQuant Screening method
- How to create a new Calibration
- How to export/import IntelliQuant files
About IntelliQuant Analysis
Information about the IntelliQuant Analysis and IntelliQuant Screening page sections defined by the red boxes on the following image is provided below.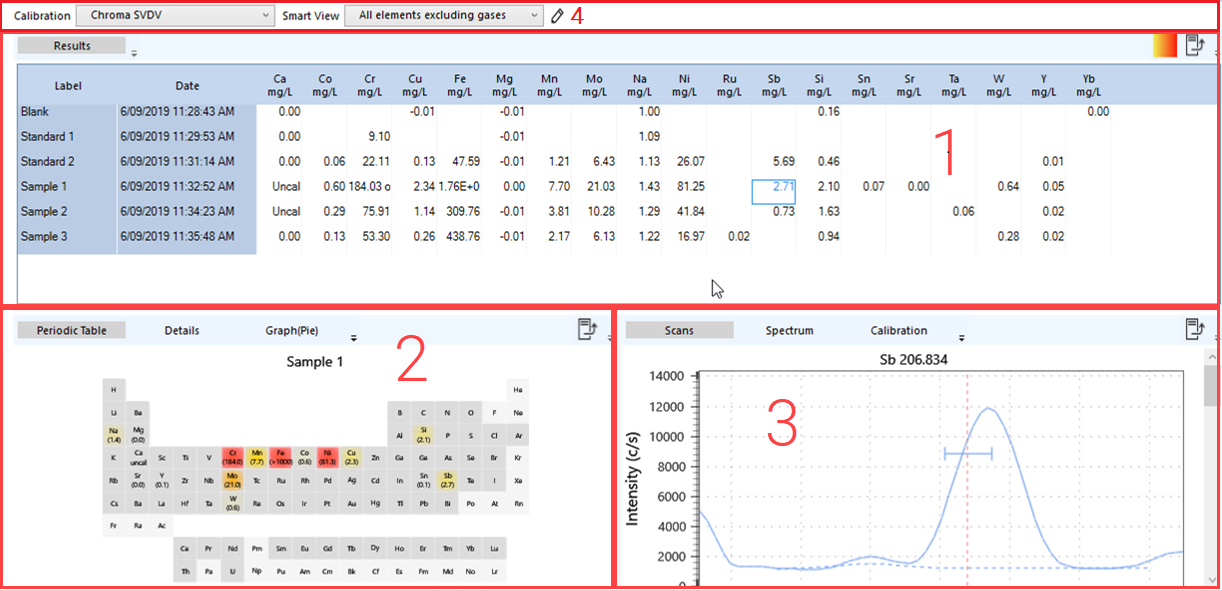
1. Results Table
The table displays all concentration values of every element detected in all currently analyzed samples.
Clicking on an element cell zooms to show detailed spectrum around the primary wavelength of the selected element. Scroll down in the Scans tab to see spectra for the other wavelengths found. This displays the same information as if you clicked on the element in the periodic table.
Adjusting the display
- Click [C] to display the concentration of each element.
- Click % to display the percent of each element in the measured sample.
- Click
 to apply the heat map to results for easier viewing. Click it again to remove the heat map.
2. Periodic Table, Details, Graph (Pie), Graph (Bar), Graph (Scatter)
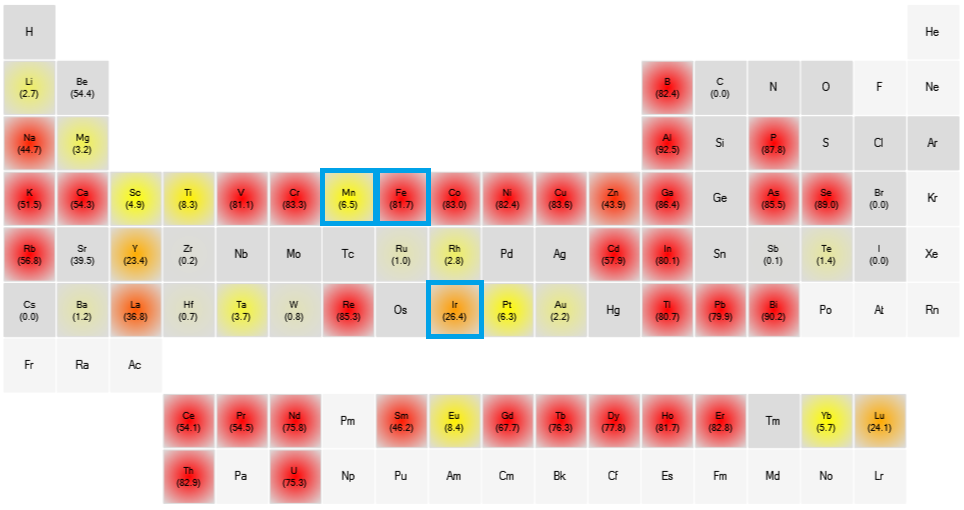
The periodic table displays both the numeric value and the concentration map (using color gradients) of concentrations of any element present in the selected sample.
The concentrations are indicated by colors shown (displayed as a solid color or as a mix of two):
- Pale grey — not an active element
- Dark grey — active element but not present in the analyzed sample
- Yellow — low concentration
- Orange — mid-range concentration
- Red — high concentration
For example, in the image below, indicated in blue boxes, Fe is present at 81.7 ppm and shows as bright red. Mn is present at a much lower concentration as indicated by a yellow highlight. Ir is present in a mid range concentration and is indicated by orange.
The concentration color map thresholds are set on the Smart View Editor.
Clicking on an element cell in the periodic table or in the results table shows the detailed spectrum around the primary wavelength of the selected element. Scroll down in the Scans tab to see spectra for the other wavelengths found. This displays the same information as if you clicked on the element in the periodic table. View more information about the selected element in the Graphs and Details tab.
3. Details
The Details tab shows the wavelengths of all of the detected elements. The wavelength used is checked. A confidence rating based on signal strength and interferents is assigned.
4. Graph (Pie, Bar and Scatter)
The Pie graph show the percentage contribution of each element in the sample.
The Bar graph shows the concentration of each element in the sample.
The Scatter graph shows a summary of the sample concentration per element over a number of samples.
5. Scans
Displays the zoomed in spectra for all wavelengths found for selected element, the background and peak marker.
6. Spectrum
Shows entire linear spectrum. Once an element is selected, click the X-axis and drag to scan across the spectrum quickly.
7. Log
Displays the detailed information for the selected element including interferences, which elements are removed due to the interferences and why the final wavelength was chosen. The information can be unfiltered where the selection process for all elements in the sample is listed, or view details or a summary of the selected element.
8. Calibration and Smart View
The calibration shows the IntelliQuant calibrations which are available for the instrument model that corresponds to the current worksheet.
The Smart View drop-down lets you choose specific elements, specify heat map thresholds, and create rules regarding what to display in the results.
See also: