IntelliQuant Analysis and Screening Methods
Using IntelliQuant allows you to retrospectively review elements not previously selected in your analysis.
For more information see:
- Setup and run a quantitative method with IntelliQuant enabled
- Setup and run an IntelliQuant Screening Method
- Exporting and Importing IntelliQuant Files
- Create or edit a Smart View to customize flags, create rules and select which elements are shown
- Create a new Calibration
IntelliQuant is not available when using ICP Expert with 21 CFR 11 functionality enabled.
Setup and run a quantitative method with IntelliQuant enabled
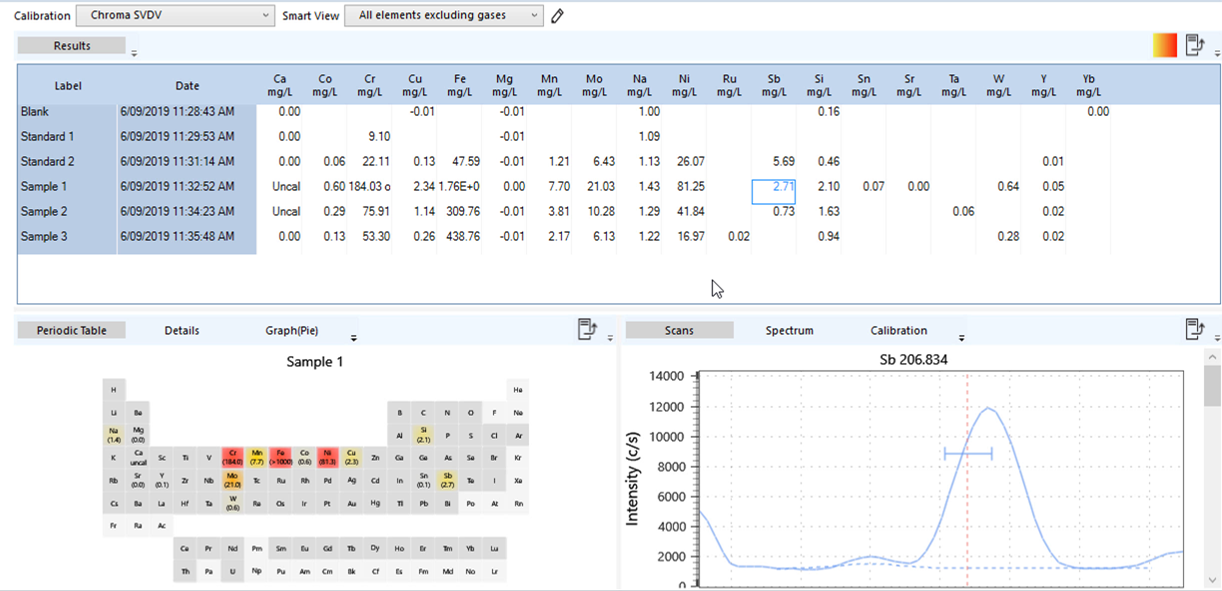 |
This video describes how to setup and run a quantitative method with IntelliQuant enabled and how to view the data and customize the display. |
- Open ICP Expert.
- Click New > Quantitative on the Start page or File > New from the menu.
- Select the desired options on the Configuration page.
- Select the desired elements.
- Enter the common and measurement conditions.
When using multiple conditions sets, the IntelliQuant measurement will use the conditions defined in the first condition set. The IntelliQuant measurement will occur between the first condition set measurement and subsequent condition set measurements. - Enter the standards information.
- Enter the number of samples, select the autosampler rack/tube locations, and edit the sample names on the Sequence page.
- Confirm that the solutions in the autosampler are in the correct locations specified on the Autosampler page.
- Save the worksheet and then click Run to start the analysis.
Setup and run an IntelliQuant Screening Method
The procedure to setup and run an IntelliQuant Screening method is very similar to the one to setup and run a quantitative method with IntelliQuant enabled with the exceptions listed below. However, customizing the results display is the same. To see how to do this, view the video below and then click View IntelliQuant Results and Configure IntelliQuant Settings in the video's table of contents.
|
This video describes how to setup and run a quantitative method with IntelliQuant enabled and how to view the data and customize the display. |
The main differences between a quantitative method with IntelliQuant enabled and an IntelliQuant Screening method are:
- All elements are checked.
- Choose Standard or Snapshot mode on the Conditions page. To use IntelliQuant Screening during method development to help select wavelengths for use in Quantitative mode, run in 'Standard' mode.
- No background correction is selected.
- An appropriate Calibration file is chosen on the IntelliQuant Analysis page which provides the calibrations.
- A Smart View is selected that defines which, and how, elements are displayed in the results table. All element data is still available, just not displayed depending on the Smart View chosen. Different Smart Views can be applied after analysis.
To setup and run an IntelliQuant Screening method:
- Open ICP Expert.
- Click New > IntelliQuant Screening on the Start page or File > New IntelliQuant Screening from the menu.
- Select the desired options on the Configuration page.
- Entered the common and measurement conditions.
- Select between Standard and Snapshot mode on the Conditions page.
- Standard mode is the normal IntelliQuant measurement mode. It can take anywhere between 5-40 seconds per sample depending on the complexity of the spectral data, and can handle peaks up to around 40 million counts before over-ranging.
- Snapshot mode always takes around 5 seconds, but it has a more limited dynamic range and will over-range at about 1.4 million counts.
 |
Because IntelliQuant will attempt to avoid displaying over-ranged results, different wavelengths may be selected as the 'best' depending on which mode is selected. |
- Enter the number of samples, select the autosampler rack/tube locations, and edit the sample names on the Sequence page.
- Confirm that the solutions in the autosampler are in the correct locations specified on the Autosampler page.
- Select the appropriate calibration for the instrument and viewing mode (RV, Axial, SVDV).
- Select the appropriate Smart View or create a new one to customize which elements are displayed.
- Save the worksheet and then click Run to start the analysis.
Create or edit a Smart View
Select one of the Custom Views or create a new view from the drop-down menu to customize IntelliQuant data display and calculations. Smart Views are comprised of selected elements and thresholds for color displays on the Periodic table. Examples of supplied views include 'All elements' and 'All elements excluding gases'.
- Open or create a new IntelliQuant Screening worksheet.
- On the IntelliQuant Analysis page, click
 to open the IntelliQuant Smart View editor.
 - Click New Smart View to create a new view or select an existing Custom View to edit it.
- Click the Preferences tab.
- Select the required preferences.
- Include all solutions - Select to view all measured samples, regardless of whether results meet the threshold values set on the Concentration tab.
- Decimal places - Change the value to increase or decrease the number of decimal places shown in the results on the Summary Results grid.
- Click the Elements tab.
- Select the elements on the periodic table that will be included in this Smart View. Deselect those that you do not want to include in the Smart View. Blue backgrounds indicate the elements to be included. Grey backgrounds indicate deselected elements.
- Create any rules required for each element.
- Click the Concentration tab to edit the colors used to indicate the concentration of an element.
- Click Save Changes.
Create IntelliQuant rules for elements in the Smart View
All rules default to 'Any' which indicates there are no rules associated with an element.
- Any - no specific rule has been created. This rule will override all other rules created for the element.
- Greater or equal - creates a rule for an element to include it on the periodic table only if the measured value is greater than, or equal to the entered value.
- Less or equal - creates a rule for an element to include it it on the periodic table only if the measured value is less than, or equal to the entered value.
- Range - is comprised of both a 'greater or equal' and 'less or equal' rule for a specific element.
Edit a rule for an element
- Click to open the IntelliQuant Smart View editor.
- Click the Elements tab.
- Select the appropriate Custom View to edit.
- Click the IntelliQuant rules arrow to expand the elements list.

- Scroll to the desired element.
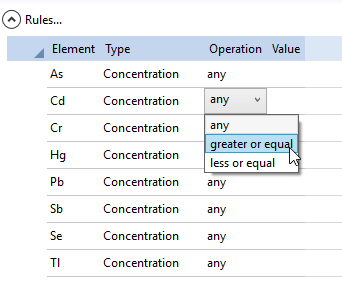
- Select the desired operation from the drop-down menu next to the element.
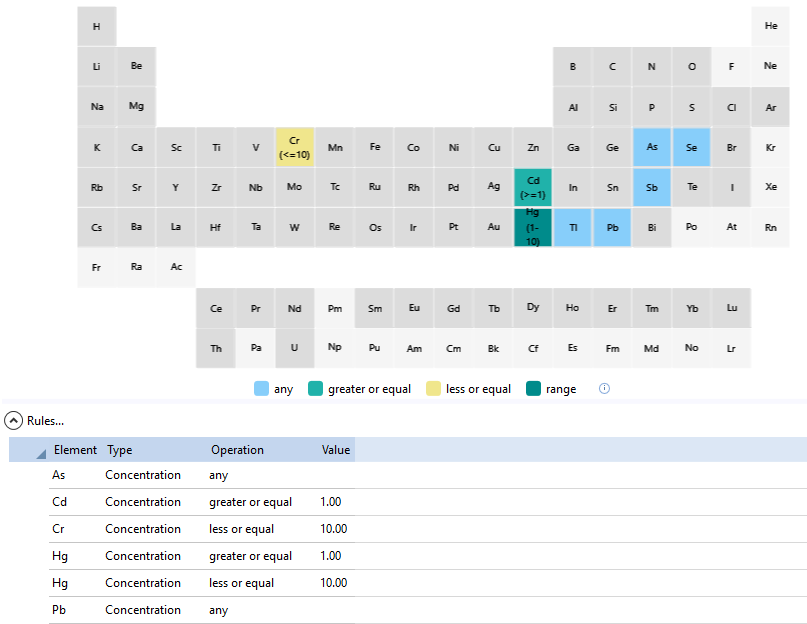
- Enter the desired value. Rules are color coded on the periodic table. The color code legend is below the periodic table.
Create a Range rule for an element
- Click to open the IntelliQuant Smart View editor.
- Click the Elements tab.
- Select the appropriate Custom View to edit.
- Click the IntelliQuant rules arrow to expand the elements list.
- Scroll to the desired element.
- Select Add greater than rule from the drop-down menu next to the element or right-click on the element and create a new 'greater than' rule.
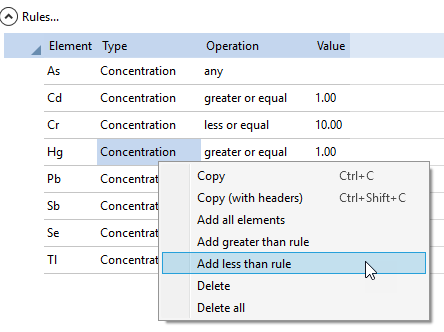
- Right-click on the element.
- Select Add less than rule.
Including both rules for the same element creates a 'range' rule.
Reset a custom view back to the original values
There is no way to reset a custom view back to the original values after it has been saved. It is recommended to always create a new Smart View if adding or removing elements or editing rules.
However, if you haven't saved your changes to the custom view you are editing, to reset it, click another custom view and then select 'No' when asked if you want to save your changes.
Set the concentration thresholds for elements to appear on the periodic table
Set the high and low concentration thresholds for all elements or each individual element.
Based on the thresholds set, element concentrations are highlighted with varying colors on the periodic table on the IntelliQuant Analysis tab. The mapping is based on IntelliQuant calibration standard concentrations.
Set the concentration threshold for all elements
- Click the Concentration tab.
- Select the appropriate Custom View to edit.
- Select All elements.
- Set the high and low threshold value that will be applied to all elements.
- Click Save Changes.
Set the concentration threshold for individual elements
- Click the Concentration tab.
- Select the appropriate Custom View to edit or create a new Custom View.
- Set the high and low threshold for each element.
- Select the 10% below low or above high rules, if needed.
- 10% below low - When selected, concentrations for that element which are measured as 10% or more below the 'low' limit set by the user will appear as a solid yellow on the periodic table, rather than the usual gradient appearance.
- 10% above high - When selected, concentrations for that element which are measured as 10% or more above the 'high' limit set by the user will appear as a solid red on the periodic table, rather than the usual gradient appearance.
- Click Save Changes.
See also: