Setup and Run a Method with FACT Background Correction
 |
This video demonstrates how to setup and run a method with FACT background correction enabled. |
FACT Models for Interference Correction
The Fast Automated Curve-Fitting Technique (FACT) page of the worksheet is where you setup your FACT interference correction. It is available if you have selected 'FACT' as a Background Correction type in the Settings per Elements table on the Conditions tab.
If the spectrum near an analyte peak is distorted by overlapping emissions from other elements, then the reported concentration results will be distorted. We’ll refer to any other elements that affect an analyte element’s spectrum as interferents. FACT removes the distortions by remembering the spectrum shapes of interferents and automatically subtracting those shapes out of your sample spectra. FACT needs to remember the spectrum shapes of a blank and analyte standard so that it can work out how much of the sample spectrum was due to the analyte.
If possible, choose the concentrations of your interferent solutions to match the expected concentrations of the interferent elements in your samples, for example, if you are measuring samples that can have high concentrations of nickel in them, then prepare a nickel interferent solution somewhere near that high concentration.
It is possible to have an element that is both an analyte (to be calibrated, measured and reported in the method) and an interferent for another of your analyte elements. Avoid using multi-element standards that contain a mixture of those elements.
You can develop up to 10 FACT models per element, which can consist of a blank, an analyte, a matrix model and the option of up to seven interferent models. The matrix and blank models will be available for all analytes.
 |
Templates can store FACT models. When a new worksheet is created from that template, the FACT models will be available in the new worksheet. |
The FACT process:
- Develop a blank model (You can select to use the blank for all FACT analyses.)
- Develop a matrix model (optional) (You can select to use the matrix sample for all FACT analyses.)
- Develop an analyte model
- Develop interferent model(s)
- Choose the models
- Test FACT
During the subsequent analysis, each spectrum measured is fitted using the models. The component due to the analyte peak model is then used to calculate the analyte intensity.
|
Matrix models can be optionally measured simultaneously for all lines using FACT. Blank models can be optionally measured simultaneously for all lines using FACT. |
|
When using FACT you must use a pure sample of the interferent and a pure sample of the analyte, as the calculations that are made assume that these samples are pure. |
|
You must have a Blank and an Analyte model included in the models to be used for FACT in order to test and apply FACT. |
Number of interferents
Set the number of interferents. Type the number or use the up and down arrows. If you have several different interferents, but each one only affects one of your analytes, you don’t have to raise the number of interferents; you can use just one interference column and present a different interferent solution for each measurement in the Interference 1 column. The number of interferents you select only has to be sufficient for the analyte that has the highest number of interferents. However, if there are two interfering elements that affect the same analyte result, increase the number of interferents to 2 and measure each interferent in a separate single element solution.
Edit model names
Select to edit the FACT model name when manually determining FACT models.
FACT models created during analysis use the selected sample name (entered on the Sequence page). You can have up to 10 FACT models per element.
Show library
Select to display the FACT library.
Worksheet Models
Worksheet FACT models are stored within the worksheet and can be viewed at a later time. They can also be saved to the FACT Library which can be accessed by all worksheets.
You can either manually create FACT models, or, by selecting the solutions in the worksheet from the drop-down menus, have ICP Expert use the spectral information contained in the selected solutions.
Label
Displays the label and wavelength of each line, as specified on the Elements screen. Click the Label column heading to list the elements in descending/ascending wavelength order.
Blank
When collecting FACT models manually, select this cell, present a blank solution and then click Read to collect a spectrum for the blank. Once the spectrum has been collected it will be displayed in the Signal Graph.
Matrix (Optional)
When collecting FACT models manually, select this cell, present a matrix solution and then click Read to collect a spectrum for the matrix. Select -- if you do not want to collect this model. Once the spectrum has been collected it will be displayed in the Signal Graph.
Analyte
Select this cell, present an analyte solution and then click Read to collect a spectrum for the analyte (use a concentrated pure standard). Once the spectrum has been collected it will be displayed in the Signal Graph.
Interferent 1
Select this cell, present an interferent solution and then click Read to collect a spectrum for the Interferent (concentrated pure solution of an element that interferes with the element of interest). Once the spectrum has been collected it will be displayed in the Signal Graph. The number of Interferent columns will depend on what you entered in the Number of interferents field.
Test
Select this cell, present your sample and then click Read to see if FACT is separating the analyte peak from the interferent peak. The display will show you the FACT models applied to the test sample spectrum so that you can see what portion of the collected spectrum is attributed to the sample, and what portions are attributed to interferents.
Read
Click to read the selected element.
Right-click Menu
To access the menu, select a cell in the table and then right-click.
- Set model type to <Manual> - reselects the manual model
- Set model type to none - does not apply a model to that selected wavelength and can only be applied to Matrix and Interferent lines
- Save worksheet model as <Manual> - if a worksheet solution has been selected and a valid measurement is present – this will convert it into a manual model
- Save model to library - select to save the model to the FACT library
Library Models
This feature is not available in 21 CFR 11 enabled software. Copy FACT models for the current worksheet into the FACT Library or copy models from the FACT Library into the current worksheet. The FACT Library is shared for all worksheets on the PC the Library was created on.
It is necessary to ensure that the chosen elements and wavelengths are compatible with the copied FACT model for the model to be viable. The element and wavelength you wish to copy must be present in the target worksheet, and FACT must be selected as the background correction type on the Conditions page.
If there is more than one copy of the same element wavelength in a worksheet, the FACT library will always copy into the first one.
Axial, Radial, and SVDV
The library can be used to store up to three different models for the same wavelength. Select the mode to save FACT model into.
Copy FACT models from the worksheet to the library
- Double-click the model.
- Right-click the cell.
- Select Save model to library.
Copy FACT models from the library to the worksheet
- Select one or more models.
- Right-click and then select Save model to worksheet.
Delete FACT models from the library
- Select one or more models.
- Right-click and then select Delete.
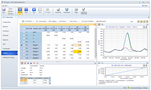
Signal Graph
Shows the FACT results selected for display in the above table. Use the magnifying glass icons to zoom in, zoom out or reset the zoom level. Right-click on the graph to export the data into a .CSV format.
Additional Information
Manual or Automated FACT Modeling
You can perform manual FACT modeling on the analytes and interferents on this tab by clicking the appropriate column and then clicking 'Read'. Alternatively, you can choose one of the standards as the analyte used when modeling and any of the samples for Interferent 1, 2, 3 etc.
See also: