Analysis Page
Click here for information on how to setup and run methods.
Click here for a software overview that includes information about the Analysis page.
Click here for information on Standard Bracketing.
 |
All features on the Analysis page are available in both the ICP Expert and ICP Applet view. |
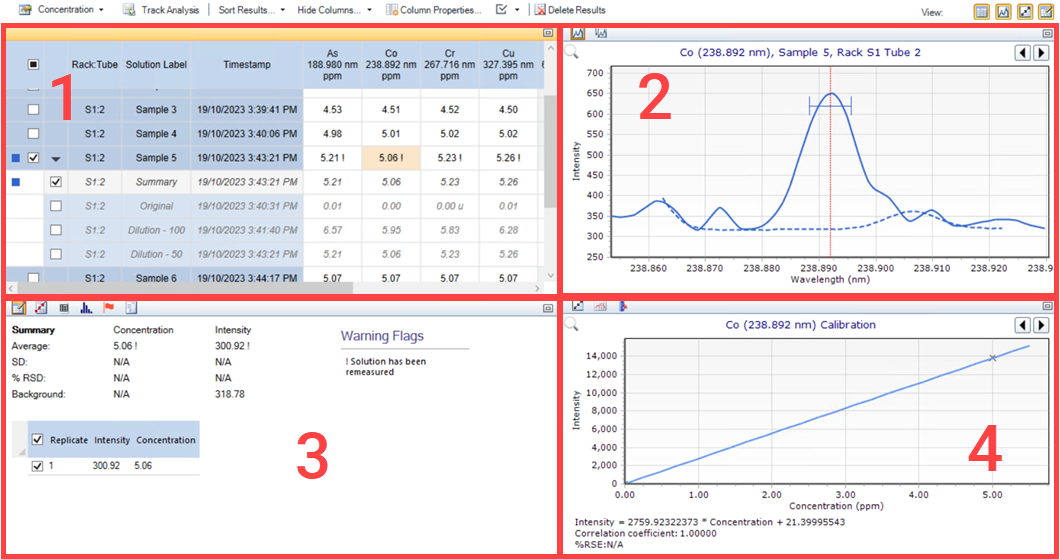
The Analysis page of the worksheet is where you can select samples for analysis, and collect, view and edit analytical results.
 |
|
Where: 1. Results table 2. Spectrum display 3. Replicate and Calibration data, Interferences, Outlier setup, USP validation (not shown on this image), and the Operations Log and 4. Calibration graph, Trend Analysis, Internal Standard Ratio and Sample Trend |
Edit Column Properties
Select the column or columns to change the units for the selected columns, edit the number of significant figures and decimal places displayed, select whether a column is visible and which results flags are displayed in the results table.
Editing Properties on Multiple Columns
To select multiple columns:
- Right-click on a column.
- Select Column Properties.
- Press CTRL or SHIFT on the keyboard and select the desired columns.
- Select or deselect the properties as needed.
Add/Edit Custom Column
Add/Remove/Edit Custom Columns
- Right-click on the Results table.
- Select Add Custom Column.
- Enter the custom column name.
- Enter the name for the custom column in the Name field. The name must have at least one letter. Invalid names and equations are indicated by a red ! .
- Double-click the appropriate wavelength, MultiCal column (if enabled) or custom column to add it to the equation.
- Right-click in the equation field to access a list of available operands or use the keyboard to add an operand to the equation. Valid operands are: ( + - / * abs ).
- Continue until the equation is done.
- Click Add.
|
Always add a space after entering a number. |
To delete the custom column from the results table right-click the custom column and then select Remove Custom Column.
All custom column calculations convert all column values to "g/mL" before the equation is evaluated. For example, results in ppm/mg/L etc will be divided by 1000000, % will be divided by 100, etc before evaluation of the equation. The units selected in the Column Properties can then be used to convert the result to an appropriate unit (as defined in the "Units" definitions under "Options").
Edit MultiCal Column
This will appear only if Enable MultiCal view and MultiCal summary concentration are selected on the Standards page.
To select the column wavelengths and calculation method:
- Right-click on the MultiCal summary concentration column.
- Select the Elements to be used in the calculation.
- Select the calculation method:
- Average
- Median
- Minimum
- Weighted Average - This is an intensity weighted average
- Choose whether to include outliers. Measurements flagged with under and overrange results are included in the MultiCal Summary column.
|
When using 21 CFR Part 11 software, Edit MultiCal Column is enabled only if the user has the Results Editing privilege. Any change when using these features is added to the CFR Audit Trail. |
IEC Solutions
Deselect this option to hide the IEC block from the sequence, freeing up sample tubes in the standards rack the autosampler.
|
This option is only visible/available for worksheets with IEC enabled on the Elements page, defined interferent wavelengths and existing IEC calibration data. |
Concentration Results
Click the down arrow or button to choose whether to display data as concentration, intensity or unadjusted concentration results.
- Concentration Results (Concentration): Displays the concentration results, with sample weight/volume/dilution corrections (if applicable) applied (sample concentration results).
- Intensity Results (Intensity): Displays the measured intensity results.
- Unadjusted Concentration Results (Unadjusted): Displays the concentration results, without sample weight/volume/dilution corrections (if applicable) applied (solution concentration results).
Track Analysis
Select to track the analysis as it progresses. Deselect to view selected data.
Sort Results
Click the down arrow to choose how to display the results.
Options include:
| Category | Type |
|---|---|
| Column Ordering | Alphabetical |
| Wavelength | |
| Type | |
| Results Ordering | Sequence Order |
| Timestamp Order |
Hide Columns
Use to show or hide specific columns. Select a column, or press SHIFT or CTRL and left-click to select multiple columns, to hide. Available selections are dependent on how the worksheet is setup (whether there are Internal Standards, a MultiCal summary, etc.)
Column Properties
See the description above for more information about column properties.
Changing the Default Measurement Selection Display Options
Click the arrow next to the Measurement Selection icon ![]() to select between the following measurement display options.
to select between the following measurement display options.
Default (Recommended)
Default has the following behavior.
- If a solution has not been reactively diluted, and the solution is remeasured, the newest iteration automatically becomes the displayed measurement.
- If a solution is reactively diluted, the summary row automatically becomes the displayed iteration.
Summary
Summary has the following behavior.
- When selected, the first value within the calibration range from across all measurements is displayed.
- If there are no values with the calibration range, the closest measurement to the highest calibration standard is displayed.
- If there are only saturated results, a hash mark '#' is displayed.
- A dash '-' is displayed for ISTD wavelengths as it is not possible to show an appropriate value.
- If a measurement has all replicates deselected, this measurement is not considered for the summary result row.
Latest
Displays the last measurement taken.
Delete Results
Click this to remove all results from the worksheet. You can also press CTRL+DELETE to delete results. Once the results are deleted, you can not retrieve them.
When using the 21 CFR Part 11 software, you cannot delete results.
View
Click the appropriate icon to display (or hide) the Results table, Spectrum Display, Replicates/Calibration Data table and the Calibration Graph.
1. Results Table
Right-click the results cell to access more features including Add/Remove Duplicate, Export Selected Solutions, Measure and Set Sample Units.
Add/Remove Duplicate
Adds a duplicate column of the selected element or removes the selected duplicate column.
Export Selected Solutions
Exports the selected solutions into a .csv file format. Microsoft Excel format is also available in the ICP Expert Pro feature pack.
|
When using 21 CFR Part 11 software, Adding, Removing, or Editing Custom Columns is enabled only if the user has the Results Editing privilege. Any change when using these features is added to the CFR Audit Trail. |
Diluted Solution Results
See the Autodilution page for information about this feature.
2. Spectrum Display
See Spectrum display for information on the spectrum.
3. Replicate Data
This is the default view of the table in the lower left corner of the Analysis page and is accessed by clicking the Replicate Data icon. ![]() Error or solution flags will appear next to this table.
Error or solution flags will appear next to this table.
Concentration
All measurements below this header are statistics relating to the solution concentrations.
Intensity
All measurements below this header are statistics relating to the solution intensities.
Average
Shows the average of both the concentration and the intensity for all selected replicates.
SD
Displays the standard deviation of all selected replicates for both the concentration and intensity.
%RSD
Displays the relative standard deviation of all the selected replicates for both the concentration and intensity. This RSD value is calculated on the intensities. The percentage Relative Standard Deviation (% RSD) is a measure of the precision of the measurement (or how reproducible the result is) when multiple replicate readings are made on a given sample. The precision is dependent on the intensity of the signal, the care with which samples and standards are prepared, and the stability of the optical system.
Check box
Select which replicates are to be included in the statistical calculations and the analysis worksheet table. This is used to edit out, or select the replicates of a selected element (the result cell is selected from the worksheet display). Once a result cell is selected, its replicates and the mean results are displayed in the replicates panel.
Replicate
Shows the number of replicates.
Concentration
The concentration column displays either the set concentration or the calculated concentration for each replicate. If you are looking at a standard, you will see the concentration shown as the defined concentration. For all samples and QC you will see the calculated concentration.
Method Concentration
When a standard is selected in the analysis table while Replicate Data is selected, Concentration changes to Method Concentration. The table then displays the user assigned concentration or each standard used in the calibration curve.
Intensity
Displays the intensity of each replicate.
Calculated Concentration
When a standard is selected in the analysis table while Replicate Data is selected, this column appears and displays the actual concentration according to the calibration equation for each standard in the calibration curve.
3. Calibration Data
Shows the statistics related to the calibration fit of the element selected. It is accessed by clicking the Calibration Data icon. ![]()
Standards
Shows all the standards included in developing the calibration curve for this element line.
Measurement
Indicates which measurement results are displayed. If the standards were autodiluted, selecting the diluted standard in the analysis table would change the Measurement information displayed.
Intensity
Shows the average intensity of each standard used in creating the calibration curve.
Method Concentration
Shows the user assigned concentration or each standard used in the calibration curve.
Calculated Concentration
Shows the actual concentration according to the calibration equation for each standard in the calibration curve.
% Error
The % difference between the method concentration and the actual concentration for each standard used in the calibration curve.
3. Interferences Table and Graph
These are the same Interferences table ![]() and graph
and graph ![]() shown on the Elements page.
shown on the Elements page.
3. Show Operations Log
Shows the operations that have taken place in the ICP Expert software. It is accessed by clicking the Show operations log icon. ![]()
3. Outlier Setup
This is accessed by clicking the Outlier Setup icon ![]() . Enable and set the Pass Value for 6 different Outlier Flag Rules. When the Pass Value is not met, the affected results in the Results table are color coded for easy identification. Choose Display flagged only to show only the results that did not meet the selected rule.
. Enable and set the Pass Value for 6 different Outlier Flag Rules. When the Pass Value is not met, the affected results in the Results table are color coded for easy identification. Choose Display flagged only to show only the results that did not meet the selected rule.
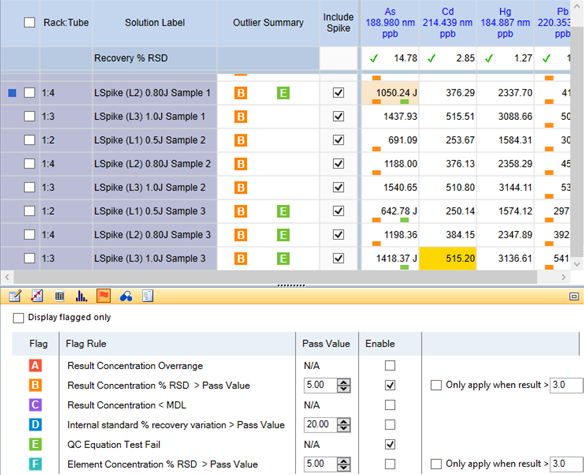
Example of two rules selected and applied to the results
3. USP Validation
Available only in ICP Expert Pro or ICP Expert with 21 CFR 11 enabled. Enable USP <232/233> and ICH Q3D expanded QC on the File > Options menu and Configuration tab. Click the USP Validation icon  to access this section.
It includes a drop-down list for all USP method validation tests. For more information, see the USP <232/233> and ICH Q3D page.
4. Calibration Graph 
The calibration graph displays the calibration graph for the element or wavelength selected in the element table. Right-click to Export the graph or apply graph smoothing.
4. Trend Analysis 
Displays the argon intensity and nebulizer pressure variations for each sample analyzed. It is accessed by clicking on the Trend Analysis icon ![]() on the Calibration graph in the lower right corner of the window.
on the Calibration graph in the lower right corner of the window.
This is useful for troubleshooting and to identify changes over time that may indicate maintenance is required.
This feature is only available when using ICP Expert Pro.
4. Internal Standard Ratios 
It is accessed by clicking on the Internal Standard Ratios icon ![]() on the Calibration graph in the lower right corner of the window.
on the Calibration graph in the lower right corner of the window.
Appears only when at least one wavelength in the worksheet is an internal standard. This is useful to easily identify changes in internal standard ratio over the course of a worksheet run. The chart plots the ratios of all of the wavelengths which have been assigned the 'Internal Standard' type on the Elements page on a per-solution basis. Hide and display the data for each internal standard wavelength by selecting or deselecting the wavelength check box.
Click here for information on Internal Standards when used in Standard Bracketing.
4. Sample Trend 
It is accessed by clicking on the Sample Trend icon on the Calibration graph in the lower right corner of the window.
Displays all sample and standard data points for the selected wavelength collected during the run.
This is useful for troubleshooting and to identify changes over time that may indicate maintenance is required as well as viewing sample result patterns or consistency.
See also: