About the Spectrum Display
This is viewed on the Analysis page and is the top right pane.
Graphics Display
Displays a wavelength vs. intensity graph of the selected line. Successive spectra for the same line may be overlaid in the window if the Overlay is selected in the right-click context menu.
Single spectrum view
Accessed only from the single graph icon  at the top of the spectrum display panel.
Displays the averages of the replicates for the selected solution and wavelength.
Multi spectrum view
Accessed from the multiple graph icon  at the top of the spectrum display panel or by right-clicking on the spectrum while in the single spectrum view.
Displays all of the collected spectra for the selected solution.
IEC factors view
Accessed only from the IEC factors icon  at the top of the spectrum display panel, this table displays the calculated IEC factors.
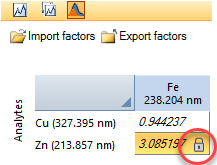
IEC Factors are automatically calculated based on the worksheet results. To directly edit these factors, double click on the value.
To prevent the automatic recalculation of edited IEC values, hover the cursor over the cell and then click the lock icon in the table.
Unlocking the lock icon will automatically recalculate the IEC value from the worksheet results.
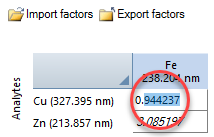
The table comprises columns of each of the interferents included in the IEC. The rows contain each of the elements (or analytes).
Analysis of a worksheets IEC block solutions will fill the table with IEC factors. Inter-Element Corrections will then be automatically applied to subsequently analyzed standard and sample concentrations.
 |
Where cells are reported with Error flags, note that these flags are assigned prior to the corrections being applied. |
|
Prior to running your worksheet, ensure that on the Standards page you have included a standard for each of the analytes included in the Inter-Element Correction. |
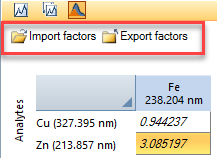
Importing and Exporting IEC factors
IEC factors can be imported from, or exported to .csv by selecting the respective button located above the IEC factors table.
|
The imported .csv format needs to be in exactly the same format as the IEC table with interferences listed along the first row and analytes listed down the first column. |
|
Click and drag the IEC factor icon to open the IEC factors table in a pop-out window. |
How are IEC factors calculated?
Graph shortcut menu
Right-click on a graph to display a shortcut menu with the following items:
Export
Enables you to export the graph data to a Microsoft Excel .csv or .xlsx* file.
*Available only with ICP Expert Pro software.
Graph smoothing
Graph smoothing fits a smooth curve through the data points.
Tracking cursor
If selected, will provide a cursor on the graph that displays the wavelength, intensity and parameters used to collect the data.
Overlay
Enables you to view the results of multiple spectrum scans of a line within the scan display. The spectrum scans will be displayed in different colors. If the Overlay option is not chosen, the current spectrum scan(s) will be cleared before a new scan is displayed. Overlaid scans are scaled in accordance with one line. The default line chosen is the highest selected. You can choose to scale for any line by zooming in on that line.
To view a specific scan on the Analysis page, hover the cursor over the desired sample row to highlight the scan.
Background correction
Select to edit the background correction type and to adjust the left, right or both peak markers.
Tell me more about background correction.
Display
This option appears only in the selected sample graph on the analysis page.
- Display averages will show the averages of the replicates analyzed.
- Display replicates will show each replicate analyzed.
- Display Remeasurements will display all remeasurements for a selected sample.
Display grid
Select or deselect to show or hide the grid inside the graph.
Display background
Select or deselect to show or hide the background spectrum (indicated by the blue dashed line).
Display spectral fit
Available only when using FACT background correction. Select or deselect to show or hide the Analyte spectral fit (indicated by solid green line).
Display interferent
Available only when using FACT background correction. Select or deselect to show or hide the interferent spectral fit (indicated by the dashed red line).
Using the Peak Marker
The peak marker is the vertical red dotted line that appears spectra in the graph windows to indicate the top of a peak. This marker position can be moved and applied for each selected wavelength.
Moving the peak marker
To move the peak marker left-click on the peak marker and drag to the desired position.
|
The peak marker can be moved when an analysis is in progress. |
There is a limit to the number of detector pixels (wavelength range) over which the peak marker can be moved. The range of movement is approximately 10 pixels from the marker's original position.
Ensure that the new wavelength position is the wavelength required and not a neighboring or interfering line. If you suspect that there are wavelength inaccuracies, check the wavelength calibration using a pure, concentrated standard.
Graph Markers
'H' marker
This is only seen when using Fitted, Off-peak (Left, Right, and Left+Right), and None background collection mode. The 'H' marker displayed on the spectrum represents the center wavelength point and the height (or average height) of the points. If one point is selected, the height of the 'H' line will will represent the height of this point. If more than one point is chosen, the height on the y-axis will be the average height of all of the points chosen.
The length of the line displayed will increase linearly as the value for the number of points per peak increases.
Blue-dotted line
This is seen when using Fitted or FACT background correction. The blue-dotted line displayed on the spectrum represents the background correction position for the peak. The length of the line displayed will relate to the blank model which is used to determine background correction.
Zooming In or Out on a Graph
To zoom in or out on a section of the graph, left-click and drag to the right to zoom in or left-click and drag to the left to zoom out. Alternatively, scroll the mouse wheel or click the magnifying glass icon on the top left of the graph and then choose the '+' to zoom in, the '-' to zoom out or the '1' to reset the graph back to the original view.
See also: