Setup and Run a Method with Standard Bracketing
This page includes information on the following topics:
- Method setup with Standard Bracketing
- Internal Standard ratio calculations for Standard Bracketing
- Analysis page features specific for Standard Bracketing including:
- Sample trend display
Method setup with Standard Bracketing
To setup a method with Standard Bracketing:
- Click File > New > Quantitative from the Start page or File > New from the menu bar.
- Select Standard Bracketing and QC (if required) on the Configuration page. Some options are grayed out after selecting Standard Bracketing. Review the tool tip for more information.
- Select your analytes and internal standard(s) and then assign an internal standard for each analyte on the Elements page.
- Select your analysis conditions on the Conditions page.
- Enter the number of standards on the Standards page.
- Enter the nominal ISTD weight and the weights of each standard. Weigh each to nearest mg. Change the decimal places shown based on your SOP requirements.
- Enter the final weight for each standard. The final weight is the weight of total amount of standards and solution to dissolve the standards.
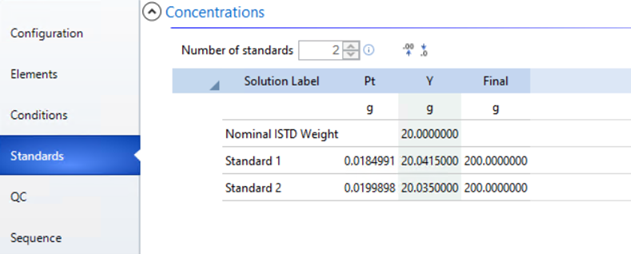
Standard Bracketing Standards page example
- Click the QC page (if selected).
- Select the QC Type from the drop-down menu and then click Add. Only "Rinse" and "SSUM" will be available to choose from.
 |
The SSUM (Sample Aggregate) QC option summarizes data for Average, Standard Deviation, %RSD, Minimum, and Maximum instead of individual measurement results. Multiple SSUM QCs can be defined and added to the same worksheet. For more information, see Sample Aggregate QC (SSUM). |
- (Optional) To change the name of the QC test (the test itself will remain the same) click the cell in the QC name column that you want to change and enter the new name.
- Select the Error Action for each QC test selected from the drop-down menu.
- (Optional) Edit the QC test definitions.
- Enter the required information on the table that appears to the right of the QC type table. Click here for information on the equations used in this example.
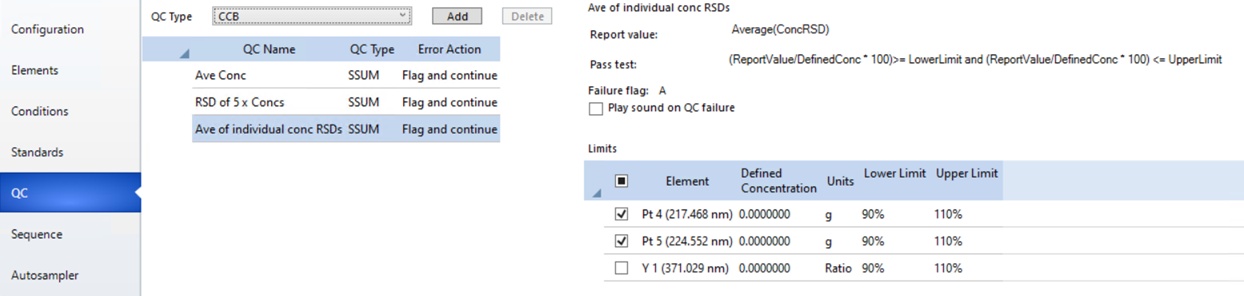
Standard Bracketing QC page example
- Click the Sequence page. Importing samples is supported with Standard Bracketing.
- Enter the number of samples.
- Edit the autosampler rack/tube positions if needed.
- Rename the standards and samples if needed.
- Either manually add a QC test or create rate driven QC tests.
- To manually add a QC test, click on the desired location in the Solution Type field in the Sequence table and then select the QC test or drag and drop the QC test from the test list into the Sequence.
- To create a rate driven QC test, select and then drag and drop the QC test or tests, into the sequence. A Preferences window appears where you can select the location in the sequence and whether it is a rate driven QC or a single occurrence.
Tell me more about Rate Driven QC.
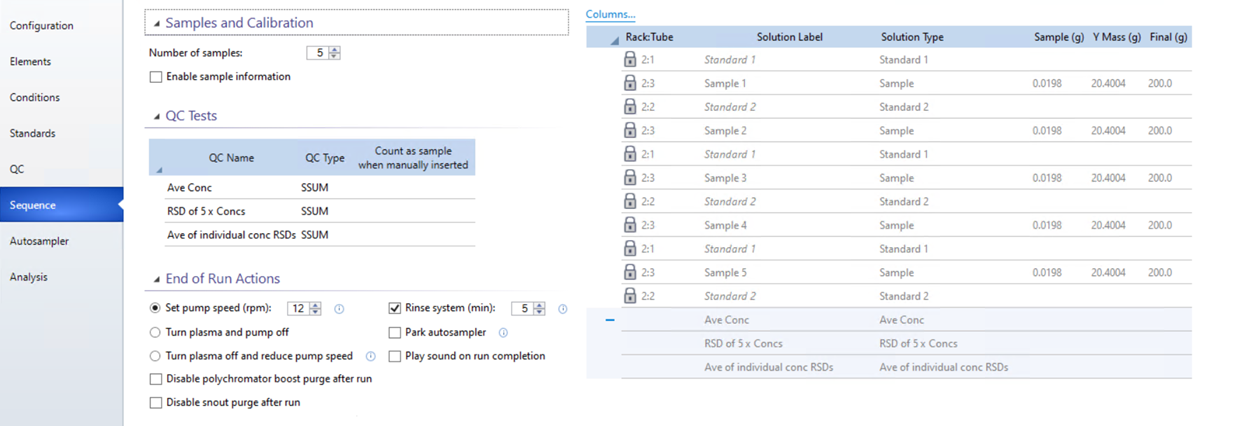
Standard Bracketing Sequence page example
- Confirm the solutions in your rack and tubes are in the correct location as indicated on the Autosampler page.
- Start the run.
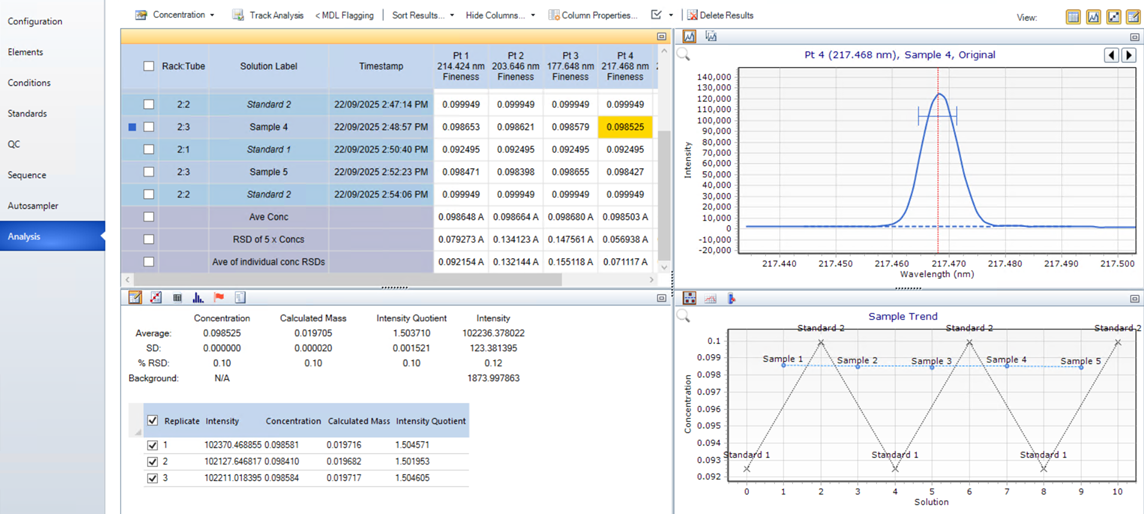
Standard Bracketing Analysis page example
Internal Standard ratio calculations for Standard Bracketing
In a standard bracketing worksheet the internal standard ratio is corrected to account for the fact that each solution can contain a different, but known, amount of internal standard. Instead of using a simple signal ratio as in a normal worksheet, the bracketing calculation incorporates the actual internal standard weight and total solution weight. The corrected ratio is determined by first dividing the measured internal standard intensity by the internal standard mass present in the solution, and then dividing that result by the total solution mass. This value is then normalized against the value obtained for the first solution in the worksheet, so that the corrected ratio for that first solution is always set to 1.0. This makes it easier for users to identify at a glance when they are experiencing significant deviations in their internal standard results, even when the masses of internal standards and solutions might vary throughout the worksheet.
Corrected Intensity = Intensity of the Internal Standard / (Weight of the Internal Standard / Final Weight of the Solution) - results are not displayed
Corrected Intensity Ratio = Corrected Intensity / Corrected Intensity of the First Solution - results displayed in the Internal Standard column for all selected analysis results display modes except Intensity. See below for all modes.
Analysis page features specific for Standard Bracketing
Analysis results display mode drop-down menu
For Standard Bracketing, there are additional selections in the analysis results display mode drop-down menu. Some cannot be used until after there are results.
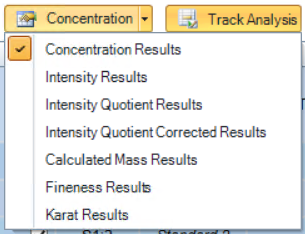
Calculations for each are described below.
Intensity Quotient Results
While this is primarily an intermediate calculation used in other equations, this can also be used as a quality metric to review how consistently the user has weighed the same ratio of sample to internal standard across each preparation.
Q = Intensity of the Analyte/Intensity of the Internal Standard
where Q is the Intensity Quotient
Each replicate Q is then averaged and that result is displayed on the Analysis page.
Intensity Quotient Corrected Results
This calculation corrects the Q value calculated in the Intensity Quotient Results for any deviations between the nominal ISTD mass and the actual mass weighed into a sample. This corrected Q value is then used to determine the calculated mass of analyte in sample.
Qc = (Weight of the Internal Standard/Nominal Internal Standard Weight)*Q
where Qc is the Corrected Intensity Quotient
Nominal Internal Standard Weight is the targeted weight of the Internal Standard, not the actual weight.
Calculated Mass Results
Mass of the analyte = Mass of the low standard + ((Mass of the high standard - Mass of the low standard) * (Qc of the sample - Qc of the low standard)) / (Qc of the high standard - Qc of the low standard)
Concentration Results
Concentration = Mass of the analyte / Final Weight of the Solution
ppm is the default unit for this equation unless specified otherwise
Fineness Results
The per mille (‰) amount of the targeted element in your sample.
Fineness = (Mass of the analyte / Weighed sample mass) / 1000
Karat Results
The Karat amount of the targeted element in your sample.
Karat = (Mass of the analyte / Weighed sample mass) / 24
Sample Trend 
Displays all sample and standard data points for the selected solution which have been collected during the run.
This is useful for troubleshooting and to identify changes over time that may indicate maintenance is required as well as viewing sample result patterns or consistency.
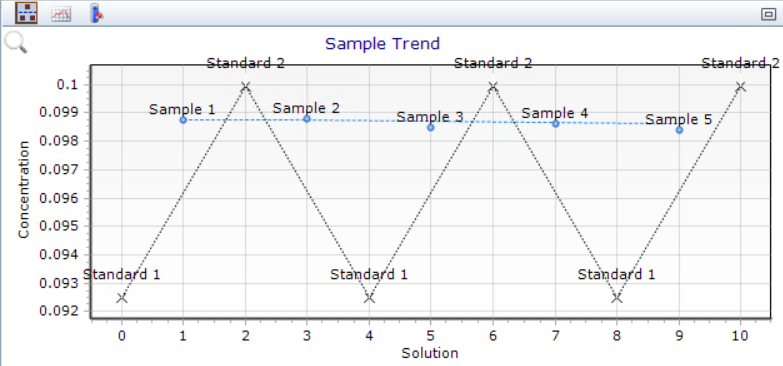
Sample trend display